● LIVE
CFBMIA 34 · CLEM 13 5:35 - 4th
CFBTTU 29 · COLO 7 0:25 - 4th
CFBWASH 21 · USC 25 1:16 - 4th
CFBMCN 14 · LSU 63 6:30 - 4th
CFBIU 44 · RUTG 15 5:19 - 4th
MLBSD 2 · MIL 2 Top 7th
NHLSTL 0 · COL 6 End of 2nd
NHLCGY 1 · VAN 0 End of 1st
NHLLA 1 · SJ 0 End of 1st
CFBMIA 34 · CLEM 13 5:35 - 4th
CFBTTU 29 · COLO 7 0:25 - 4th
CFBWASH 21 · USC 25 1:16 - 4th
CFBMCN 14 · LSU 63 6:30 - 4th
CFBIU 44 · RUTG 15 5:19 - 4th
MLBSD 2 · MIL 2 Top 7th
NHLSTL 0 · COL 6 End of 2nd
NHLCGY 1 · VAN 0 End of 1st
NHLLA 1 · SJ 0 End of 1st
⚾ MLB
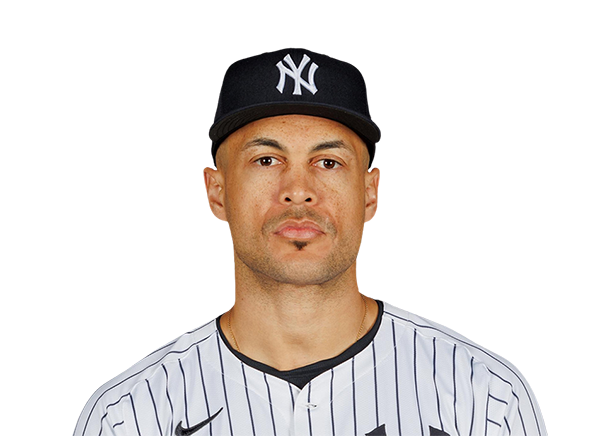
Giancarlo Stanton

Giancarlo Stanton

Next Game @ Tampa Bay Rays Oct 5
Key Stats
?

These stats describe 2026 · Playoffs. Totals cover that period; per-game values describe games played.

AVG
Hits divided by at-bats. Higher means more hits per at-bat.

HR
Total home runs in this period.

RBI
Runs batted in during this period.

H
Total hits in this period.

AB
Official at-bats; walks and certain other plate appearances are excluded.

BB
Total walks drawn in this period.

K
Strikeouts as a batter. Fewer means fewer plate appearances ending in a strikeout.

.000
AVG
0
HR
0
RBI
0
H
1
AB
0
BB
1
K
Season Context
?

These measures describe 2026 · Playoffs. Compare like periods; they are sporting measures, not predicted outcomes.

OBP
Times reaching base by a hit, walk or hit-by-pitch divided by at-bats, walks, hit-by-pitches and sacrifice flies. Higher means reaching base more often.

SLG
Total bases per at-bat. Higher means more power.

OPS
On-base percentage plus slugging percentage. Higher means more offensive production.

.000
OBP
.000
SLG
.000
OPS
Recent Form
2026 · Last 1 game · Playoffs
?

These stats cover the player's last 1 appearance in Playoffs. Totals add up performance over that stretch. Averages and percentages are calculated from the combined game figures, not averaged from individual game rates.

AVG
Hits divided by at-bats. Higher means more hits per at-bat.

OBP
Times reaching base by a hit, walk or hit-by-pitch divided by at-bats, walks, hit-by-pitches and sacrifice flies. Higher means reaching base more often.

OPS
On-base percentage plus slugging percentage. Higher means stronger combined on-base production and power.

HR
Total home runs in this period.

RBI
Runs batted in during this period.

BB
Total walks drawn in this period.

K
Strikeouts as a batter. Fewer means fewer plate appearances ending in a strikeout.

.000
AVG
.000
OBP
.000
OPS
0
HR
0
RBI
0
BB
1
K
Last 1 Game

Related