These stats describe 2026 · Regular Season. Per-game values are averages; totals cover that period.
GOALS/G Goals scored per game over 90 minutes plus stoppage time; extra time and penalties are excluded. Higher means more scoring.
GA/G Goals allowed per game over 90 minutes plus stoppage time; extra time and penalties are excluded. Lower means fewer goals conceded.
SHOTS/G Shots per game across the full match, including extra time when played. Higher means more shooting volume.
SOT/G Shots on target per game across the full match, including extra time when played. Higher means more attempts on target.
SHOT ACCURACY% Shots on target divided by total shots across the full match. Higher means more accurate shooting.
POSSESSION % Average possession percentage across full matches. Above 50% means more possession than opponents on average; it does not by itself mean better chances.
PASS % Completed passes divided by attempted passes across full matches. Higher means more accurate passing.
CORNERS/G Corner kicks per game across full matches. Higher means more corner opportunities.
2.08
GOALS/G
1.67
GA/G
13.42
SHOTS/G
5.33
SOT/G
39.8%
SHOT ACCURACY%
54.9%
POSSESSION %
86.6%
PASS %
4.33
CORNERS/G
Season Context
2026 · Regular Season
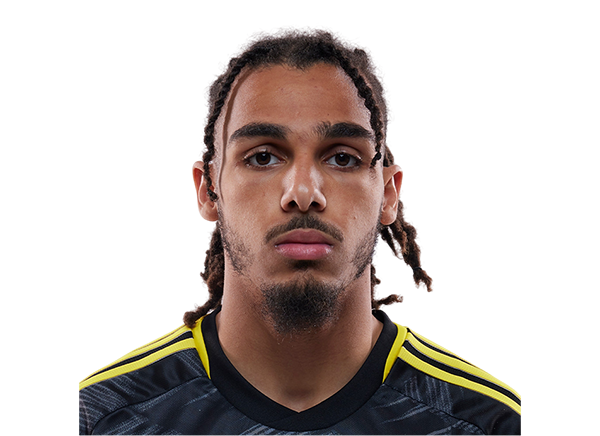
Columbus Crew
-1.42
Shot Differential
88.9%
Pass Completion %
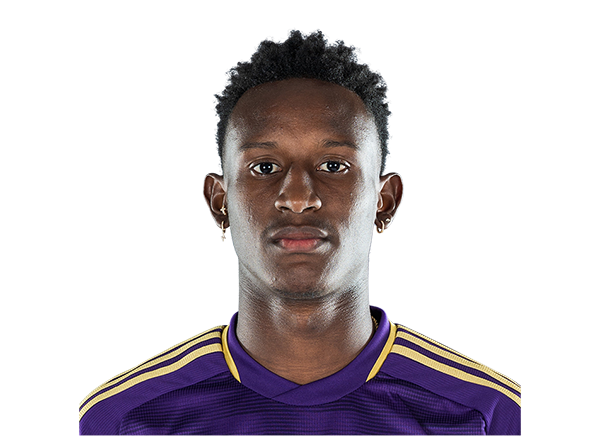
Orlando City SC
?
These measures describe 2026 · Regular Season. Compare like periods; they are sporting measures, not predicted outcomes.
Shot Differential Shots on target minus opponents’ shots on target per game. Positive means more shots on target.
Pass Completion % Accurate passes as a share of all passes. Higher means more completed passes.